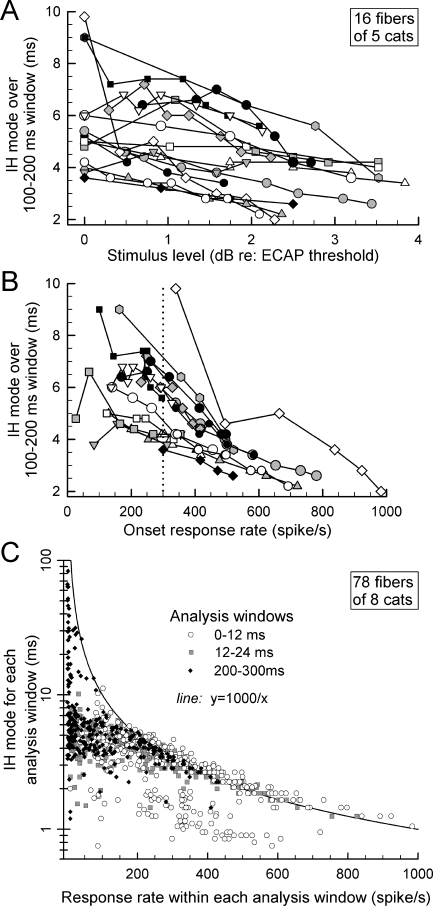
FIG. 7.
The effects of stimulus level and response rate on ISIs for ANF excited by 5,000-pulse/s trains. The effect of stimulus level on IH mode for 16 ANFs is plotted in A, whereas the effect of onset spike rate on IH mode for the same fibers is plotted in B. Systematic differences in IH mode can be seen across this group of fibers. In C are plotted IH modes for 78 ANFs as a function of response rate. Three sets of data are included in this graph, covering three response epochs. IH mode vs. spike rate are plotted for (1) the onset (0–12 ms) window, (2) the subsequent 12–24-ms window, and (3) the final (200–300 ms) response window. The hyperbola indicates the IH mode expected for ANFs firing at a constant rate. For response rates >200 spike/s, most data cluster near the hyperbola, with the exception of a subset of responses assessed over the onset (0–12 ms) epoch.

