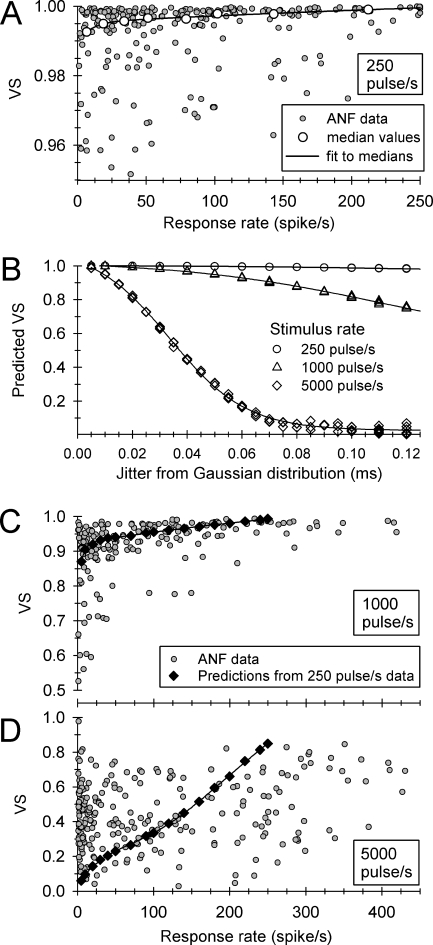
FIG. 8.
Summary of a method used to compare VS values obtained at three pulse rates. The small, filled symbols of A, C, and D show VS values obtained from 37 ANFs at stimulus rates of 250, 1,000, and 5,000 pulse/s, respectively. Across-pulse-rate VS comparisons require accounting for the effect of different pulse periods on VS. This effect is shown in B, where simulated distributions of spike times were used to relate VS and jitter for the three pulse rates. Multiple symbols for fixed jitter and pulse rate reflect multiple simulations; smooth curves connect these points. These curves provided a means of predicting VS (for 1,000- and 5,000-pulse/s rates) under the assumption that an ANF’s jitter is not affected by stimulus rate. The predicted (constant jitter) VS values are plotted in C and D using filled diamond symbols. In the case of 5,000-pulse/s stimuli, all experimental data lie below the prediction curve for response rates greater than 200 spike/s, indicating spike desynchronization.

