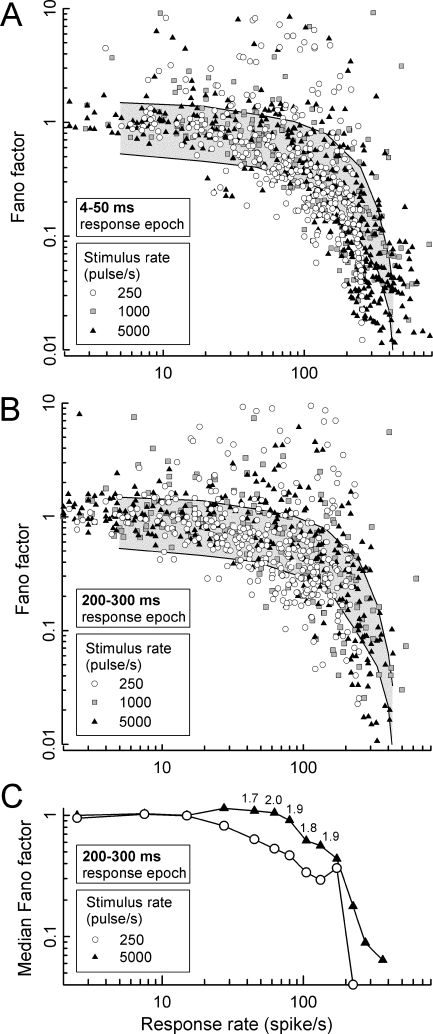
FIG. 9.
Summary of the effects of (1) response rate, (2) stimulus rate, and (3) time after stimulus onset on FF. In A and B, FFs for all ANFs are plotted vs. response rate. The gray background regions in these graphs indicate the expected region (within 99% of cases) of FFs for a Poisson process with a 2-ms dead time (i.e., a refractory-driven process). In A, FFs computed over an early response epoch (4–50 ms) are plotted for each fiber and the three stimulus rates. In B, FFs are plotted for spikes occurring in the “steady state” (200–300 ms) response epoch. In C, median FFs – computed across fibers and several ranges of response rates – are plotted for 250- and 5,000-pulse/s stimuli, again computed over the “steady state” (200–300 ms) response epoch. Consistent symbol types are used across the three panels. The small numbers appearing above selected data in C indicate the ratios of FF obtained at 5,000 and 250 pulse/s, demonstrating increased stochasticity for the high-rate responses.

