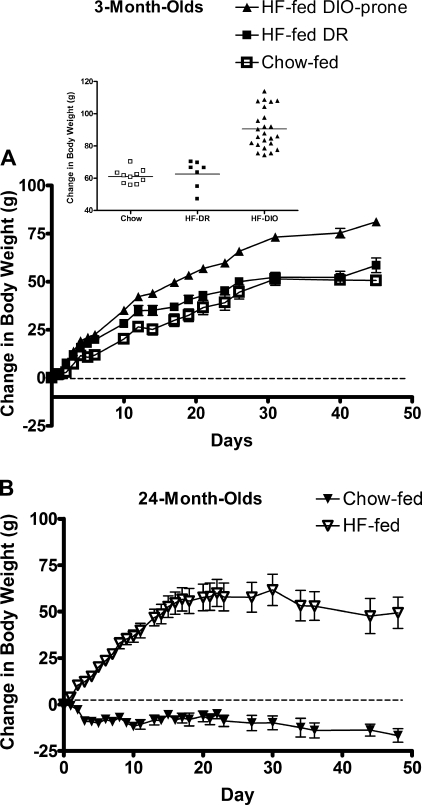
Fig. 1.
A: body weight gain in young rats on chow (open symbols) or high-fat (HF) (solid symbols) diet. Values are means ± SE of HF-fed diet-induced obese (DIO)-prone (n = 24, triangles), HF-fed diet-resistant (DR) (n = 8, solid squares), and chow-fed rats (n = 10, open squares). Inset: young rats were either prone or resistant to the effects of the HF diet. We used the maximized value of the log likelihood as a measure of model fit (larger values indicate better fit). When we assumed one normal distribution for the chow-fed together with the HF-fed DR rats, and a separate normal distribution for the HF-fed DIO-prone rats, the model fit yielded a log likelihood value of −530 compared with −542 when one normal distribution was assumed for the chow-fed rats and one normal distribution for the all of the HF-fed rats (DIO prone plus DR). This suggests that HF-fed DR rats are more similar to the chow-fed rats than the HF-fed DIO-prone rats, and thus the latter should be considered a separate group. By day 3 on the diet, the body weight gain in HF-fed DIO-prone animals was significantly greater than that of the chow-fed group (P < 0.0001 by t-test). The change in body weight was significant between the two HF-fed groups by day 15 (P < 0.05 by ANOVA). B: body weight change in aged rats on either chow (solid triangles) or HF diet (open triangles). Values are means ± SE of chow-fed (n = 5) and HF-fed rats (n = 7). All aged rats were susceptible to the detrimental effects of the HF diet. By day 1 on the diet, the HF-fed aged animals had experienced a weight gain significantly greater than that of their chow-fed counterparts (P < 0.05 by ANOVA).

