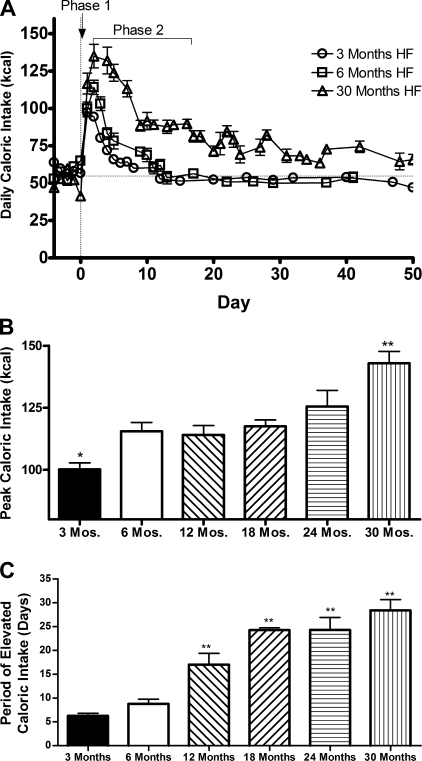
Fig. 3.
A: daily caloric intake of 3- (circles), 6- (squares), and 30-mo-old (triangles) rats on a HF diet. Values are means ± SE of 3- (n = 9), 6- (n = 5), and 30-mo-HF-fed rats (n = 5). B: the peak caloric intake after the initiation of HF feeding. Values are means ± SE of 3- (n = 24), 6- (n = 5), 12- (n = 5), 18- (n = 5), 24- (n = 7), and 30-mo-old HF-fed (n = 5) rats. P < 0.0001 for difference with age by one-way ANOVA. *P < 0.05 for the difference between 3-mo-old rats and all other ages by post hoc analysis. **P value < 0.001 for the difference between the 30-mo-old rats and all other ages by post hoc analysis. C: the days required to normalize the elevated caloric intake following HF feeding. Values are means ± SE of 3- (n = 11), 6- (n = 5), 12- (n = 5), 18- (n = 4), 24- (n = 7), and 30-mo-old HF-fed (n = 5) rats. P < 0.0001 for difference with HF feeding by one-way ANOVA. **P value < 0.001 for the difference compared with 3-mo-old rats by one-way ANOVA and post hoc.

