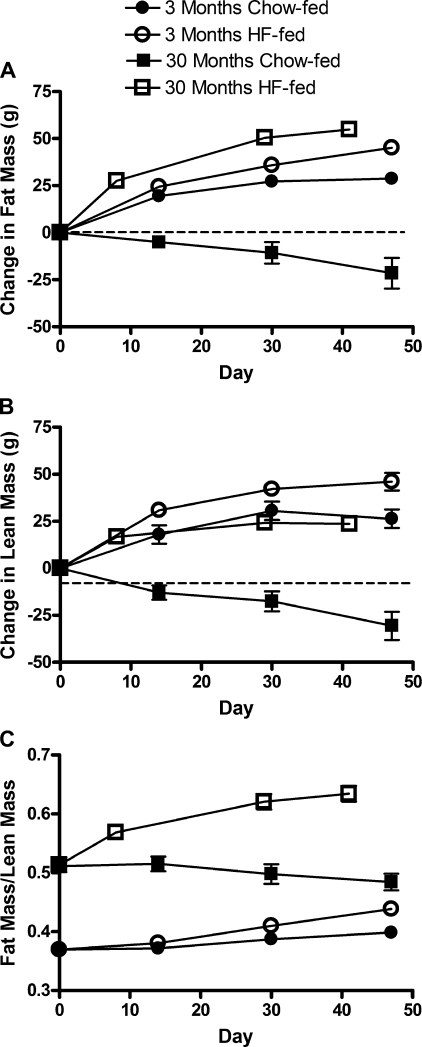
Fig. 4.
Change in fat mass (A), change in lean mass (B), and the ratio of fat to lean mass over time (C) in 3- (circles) and 30-mo-old (squares) rats on either a HF (open symbols) or a standard chow (solid symbols) diet. Values are mean ± SE of 3-mo-old chow-fed (n = 10), 3-mo-old HF-fed (n = 12–32), 30-mo-old chow-fed (n = 4–6), and 30-mo-old HF-fed (n = 5) rats. A: P < 0.0001 for interaction, for difference with HF feeding, and for difference with age by two-way ANOVA. P < 0.001 for the difference between HF-fed aged rats and HF-fed young rats by day 30 by post hoc analysis. P < 0.01 for the difference between HF-fed young rats and chow-fed young rats by day 14 by post hoc analysis. Note: P < 0.05 for the difference between the day 0 fat mass values and the day 60 fat mass values in each age/diet group by paired T-test. B: P = 0.0003 for the interaction; P < 0.0001 for the difference with HF feeding and difference with age by two-way ANOVA. P < 0.05 for the difference between HF-fed aged rats and HF-fed young rats by day 30 by post hoc analysis. P < 0.05 for the difference between HF-fed young rats and chow-fed young rats by day 14 by post hoc analysis. Note: P < 0.01 for the difference between the day 0 lean mass values and the day 60 lean mass values in each age/diet group by paired T-test. C: P = 0.0003 for the interaction; P < 0.0001 for the difference with HF feeding and difference with age by two-way ANOVA. P < 0.001 for the difference between HF-fed aged rats and HF-fed young rats by day 14 by post hoc analysis. P < 0.05 for the difference between HF-fed young rats and chow-fed young rats by day 30 by post hoc analysis. Note: P < 0.001 for the difference between the day 0 fat/lean mass values and the day 60 fat/lean mass values in the 3-mo-old chow-fed, 3-mo-old HF-fed, and 30-mo-old HF-fed groups by paired T-test.

