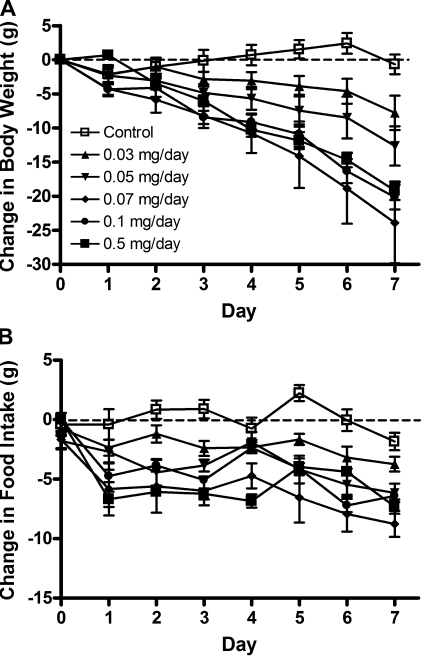
Fig. 7.
A: change in body weight during a 7-day peripheral leptin infusion in 3-mo-old chow-fed rats. Values are means ± SE of 7 rats per group. P < 0.0001 for the difference with leptin treatment by one-way ANOVA. Each individual dose is significantly different from control (P < 0.0002 for the difference in slope). B: change in food intake in young rats during a 7-day peripheral leptin infusion. Values are means ± SE of 3-mo-old chow-fed (n = 7 per group) rats. P < 0.0001 for the difference with leptin treatment by one-way ANOVA. P < 0.01 for the difference between control and each dose at day 7 and between control and each dose for cumulative food intake.

