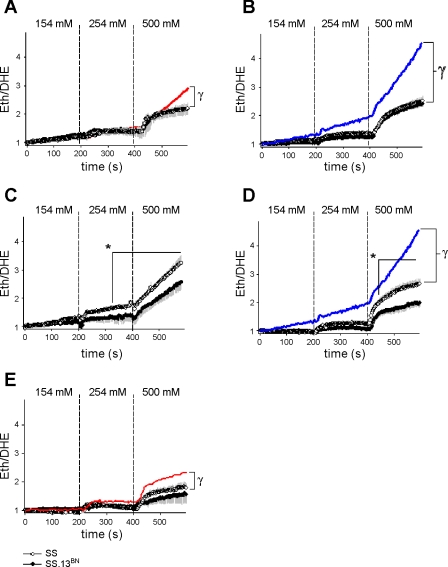
Fig. 2.
Effect of incrementing bath NaCl concentration on superoxide production in mTAL obtained from SS and SS.13BN rats in the presence of amiloride and/or ouabain. A: comparison of O2− response in SS (○; n = 8) and SS.13BN (•; n = 7) mTAL of rats fed a 0.4% NaCl diet in the presence of 100 μM N-methyl-amiloride (SS and SS.13BN data appear superimposed). Red line shows path of 0.4% NaCl-fed SS rat depicted in Fig. 1A for comparison. B: comparison of O2− response in SS (n = 9) and SS.13BN (n = 7) mTAL of rats fed a 4.0% NaCl diet in the presence of 100 μM N-methyl-amiloride (SS and SS.13BN data appear superimposed). C: comparison of O2− response in SS (n = 7) and SS.13BN (n = 6) mTAL of rats fed a 0.4% NaCl diet in the presence of 4 mM ouabain. D: comparison of O2− response in SS (n = 7) and SS.13BN (n = 7) mTAL of rats fed a 4.0% NaCl diet in the presence of 4 mM ouabain. Blue lines in B and D show path of 4.0% NaCl-fed SS rat depicted in Fig. 1B for comparison. E: comparison of O2− response in SS (n = 7) and SS.13BN (n = 7) mTAL of rats fed a 0.4% NaCl diet in the presence of 100 μM N-methyl-amiloride and 4 mM ouabain. Red line shows path of 0.4% NaCl-fed SS rat with N-methyl-amiloride depicted in Fig. 2A for comparison. *Area identified under time point = P < 0.05 for differences between strains, as determined by Bonferroni post hoc test; γsignificant difference between treatment groups.

