Fig. 2.
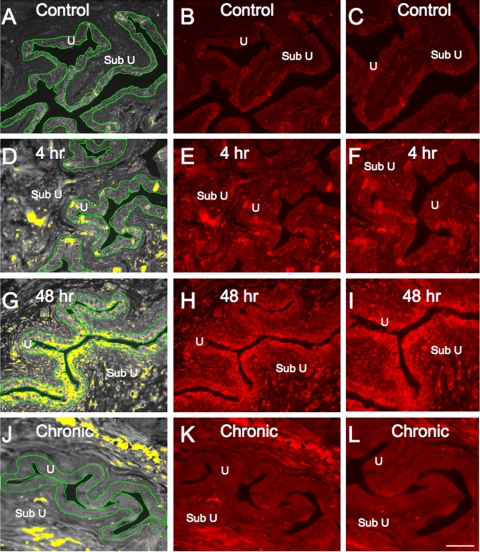
VEGF immunoreactivity (IR) in cryostat sections of urothelium after CYP treatment. Urothelium (U) was outlined (green) and measured in total-pixels area (A, D, G, and J). A threshold encompassing an intensity range of 100–250 gray-scale values was applied to the region of interest (A, D, G, and J). The same threshold was subsequently used for all images. Percentage of VEGF expression above threshold in the total area selected was then calculated. CYP (48 h; G–I) significantly (P ≤ 0.05) upregulated percentage of VEGF IR in urothelium (G, yellow stain within urothelium) compared with all other groups. Fluorescence images of VEGF expression in urinary bladder sections of control rats (B), rats treated with CYP for 4 h (E) and 48 h (H), and rats chronically treated with CYP (K) are shown. C, F, I, and L: higher-power fluorescence images of B, E, H, and K, respectively. For all images, exposure times were held constant and all tissues were processed simultaneously. In rats treated with CYP for 4 and 48 h, VEGF expression was visible in urothelium (D–F and G–I), whereas control rats (A–C) and rats chronically treated with CYP (J–L) showed little or no VEGF IR. Some VEGF IR was observed in suburothelial (Sub U) region at each time point of CYP-induced cystitis (D–L). Scale bars, 50 μm (A, B, D, E, G, H, J, and K) and 25 μm (C, F, I, and L).

