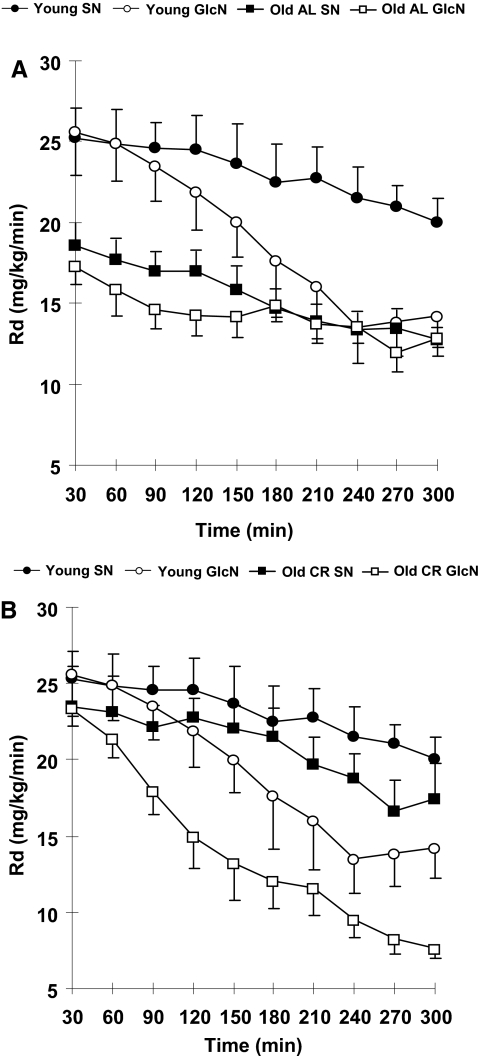
Figure 2.
Rd during hyperinsulinemic clamp with and without GlcN infusion. A) Rd over 300 min in young rats (young GlcN, n=6) compared with saline control (young saline, n=6). The mean basal Rd is lower for O-AL compared with Y-AL rats (P<0.05). No further decrease in Rd was seen in the O-AL group. B) Rd over 300 min in young and O-CR rats with GlcN infusion (young GlcN and O-CR GlcN). Both developed insulin resistance, but the interval is shorter in O-CR rats (60 min vs. 210 min in young).

