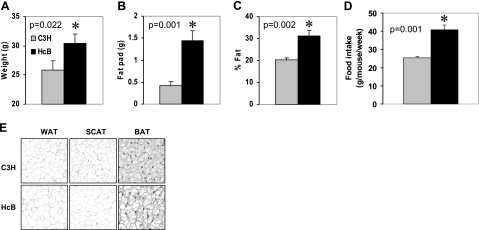
Figure 1.
Adiposity in TXNIP-deficient mice. A–C) Assessment of body weight (A), gonadal fat pad weight (B), and percentage of whole body fat mass (C) by dual energy X-ray absorptiometry in 9-month-old male TXNIP-deficient HcB-19 and control C3H mice. D) Weekly food intake as measured over a 4-wk period in HcB-19 and C3H mice. Bars represent means ± se; n = 3–6 mice per group. E) Hematoxylin staining of white (WAT), subcutaneous (SCAT), and brown (BAT) adipose tissue sections (×5).

