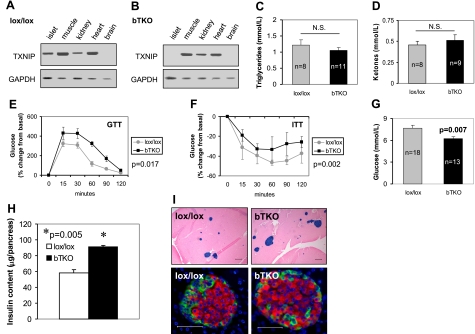
Figure 6.
Characterization of bTKO mice. A, B) TXNIP expression in different tissues of lox/lox control (A) and bTKO mice (B) as measured by RT-PCR. C, D) Serum triglyceride (C) and ketone levels (D) in bTKO and control lox/lox mice after a 4 h fast. E, F) Glucose (E) and insulin tolerance tests (F) in bTKO and lox/lox littermates. After a 4 h fast, glucose (3 g/kg) or insulin (0.55 IU/kg) was administered i.p.; blood glucose was measured at the designated time points; n = 3–8 mice/group. G) Fasting blood glucose concentration in bTKO and lox/lox control mice; n = mice/group. H) Whole pancreas insulin content as a measure of beta-cell mass in 12-wk-old bTKO and control lox/lox mice; n = 4 mice/group. Means ± se are shown. I) Top panels: representative pancreas sections of lox/lox and bTKO mice stained for insulin (blue). Bottom panels: immunofluorescent images of a lox/lox and bTKO islet stained for insulin (red), glucagon/somatostatin (green), and nuclei (blue; DAPI). Scale bars = 200 μm (top); 50 μm (bottom).

