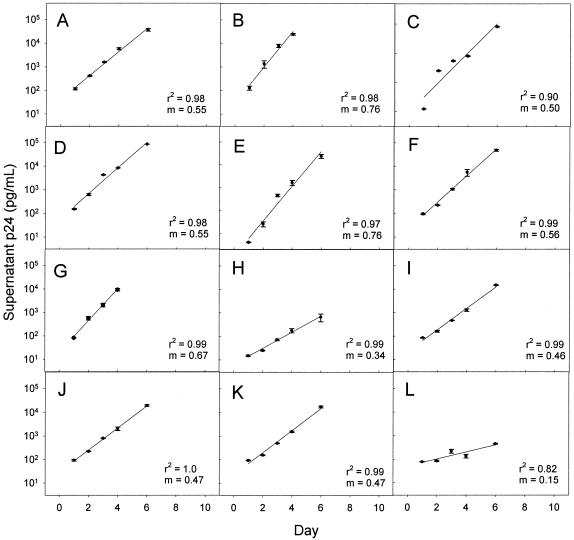
FIG. 2.
Measurement of HIV-1 replication rate. PHA lymphoblasts from a single donor were infected with NSI HIV-1 isolates from 12 different subjects on day 0. Data during the phase of exponential increase of supernatant p24 were fitted by linear regression. The coefficient of determination (r2) and slope (m) for each regression are shown. The slope (m) is the viral replication rate. All data points are the mean ± range of two parallel cultures. (A) Subject 1. (B) Subject 3. (C) Subject 4. (D) Subject 5. (E) Subject 10. (F) Subject 11. (G) Subject 13. (H) Subject 17. (I) Subject 20. (J) Subject 23. (K) Subject 25. (L) Subject 26.

