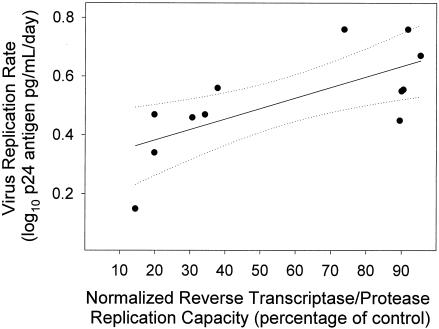
FIG. 3.
HIV-1 replication rate in PHA lymphoblasts was linearly related to HIV-1 RT and PR replication capacity. HIV-1 replication rate is the slope (m) of the regressions in Fig. 2. RT and PR replication capacity were determined in a single cycle-based assay using recombinant virus that contained the RT and PR genes of each HIV-1 isolate. The replication capacity is the percentage of virus replication relative to the reference virus strain, NL4-3. Solid line indicates fit of data by linear regression (r2 = 0.53; P = 0.007). Dashed lines indicate the 95% confidence interval for the regression.

