
Figure 4.
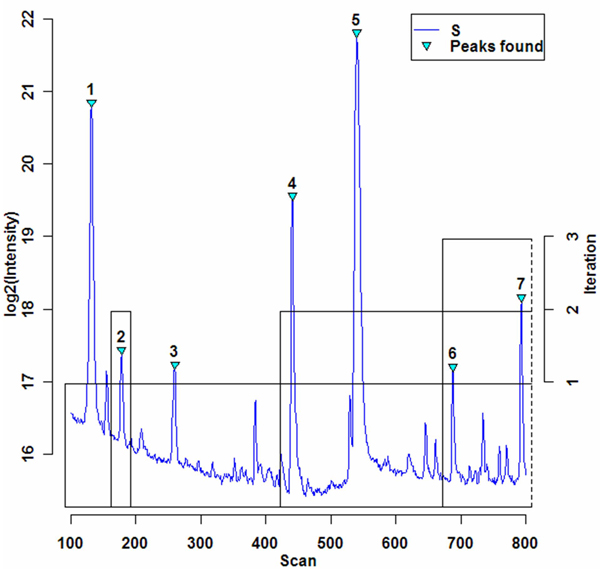
An example of iterative peak matching. A 700-scan region of S TIC is shown which has 7 detected peaks. Peaks are assigned to blocks at the start of each iteration, with blocks shown as boxes of height matching the iteration number. Intensities are log transformed for a better display of weak signals.