
Figure 5.
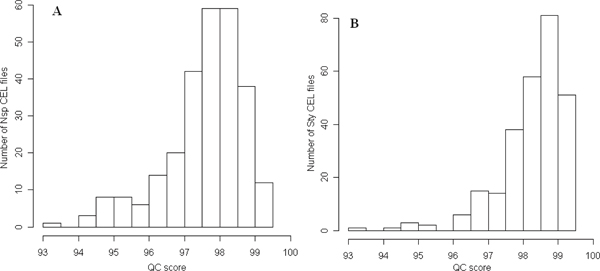
Histograms of QC confidence scores of Affymetrix Human Mapping 500 K Array Set CEL files of 270 HapMap samples. The x-axes indicate the QC confidence scores range from 0 to 100. The y-axes represent number of CEL files with QC confidence scores within a window depicted at the x-axes. A: Nsp chip CEL files of the 270 HapMap samples. B: Sty chip CEL files of the 270 HapMap samples.