
Figure 3.
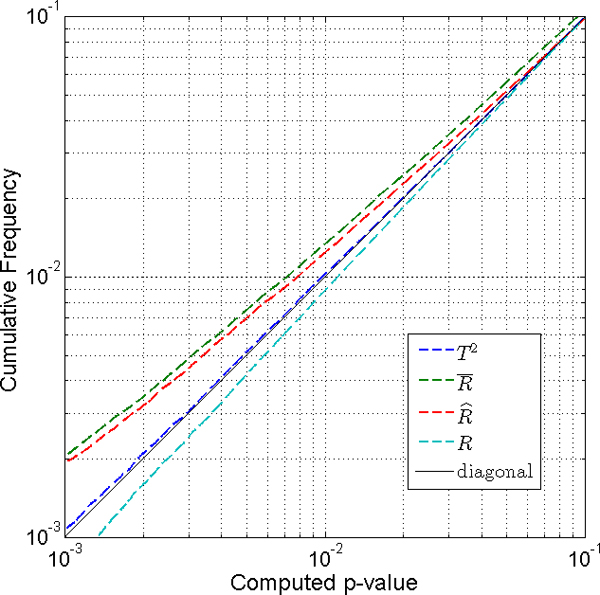
Comparison of two-sided tests with sample size n = 25. Hotelling T2 test (dashed blue line) gives the smallest difference from the uniform distribution. When we have enough number of samples to have a reasonably correct estimate of R, the method (dashed red line) is a little better than the method (dashed green line). Both the method and the method give quite accurate p-values compared to the p-values from the true correlation matrix, R (dashed cyan line).