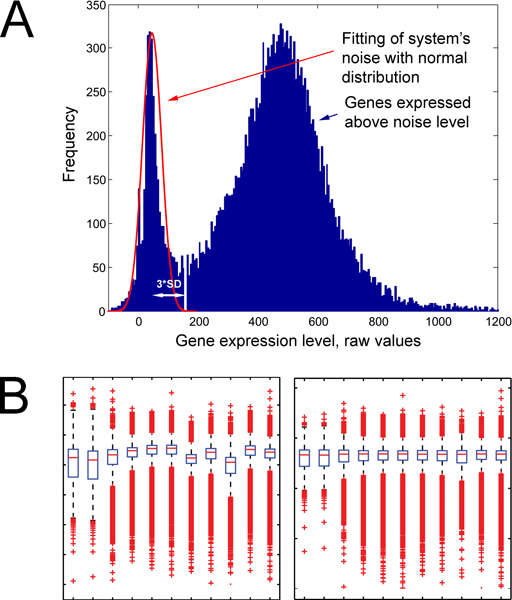
Figure 2.

Identification of noise level and microarray adjustment. A) Frequency histogram of gene expression level from one microarray dataset. The first peak in the bimodal distribution represents the normal distribution of system noise centered around zero. Genes expressed 3 SD above noise level are defined as expressed genes. B) Box plots of microarray datasets before and after linear regression, values are log10 transformed.
