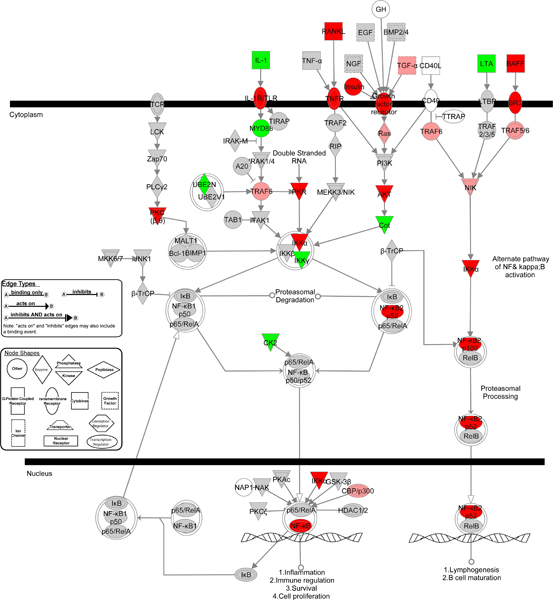
Figure 5.

The NFκB canonical signaling pathway from IPA. Dark red > 3-fold increase in gene expression; light red < 3-fold increase in gene expression; dark green – > 3-fold decrease in gene expression; light green – < 3-fold decrease in gene expression; gray – unchanged gene expression; no color – gene not in array. Gene symbols with a single border represent single genes. Double border represent a complex of genes or the possibility that alternative genes might act in the pathway.
