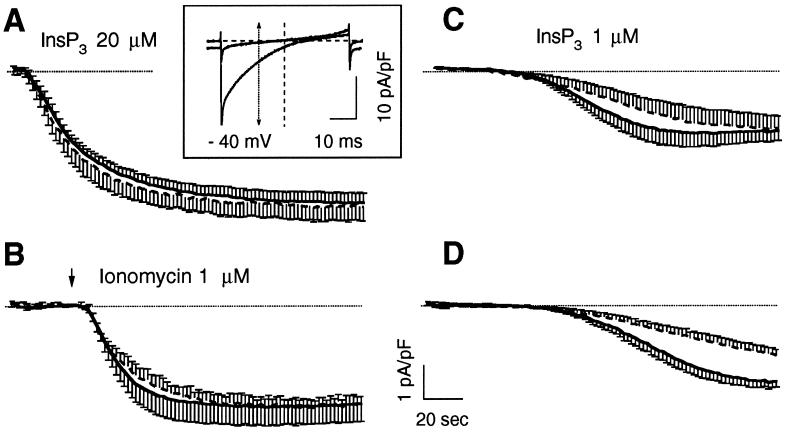
Figure 2.
Activation ICRAC by different procedures in control and CRT-overexpressing cells. RBL-1 cells transfected with the cDNA for cytGFP alone (control) or together with the cDNA for human tCRT (tCRT), as described in MATERIALS AND METHODS, were selected for GFP fluorescence and voltage clamped at 0 mV holding potential with an internal solution based on Cs-glutamate, containing 12 mM BAPTA, as described in MATERIALS AND METHODS. In A and C, InsP3 was also included at the specified concentrations. In B, current activation was boosted by application of ionomycin (1 μM) from a wide-tipped pipette positioned close to the cell. In D, ICRAC activation was induced simply by the presence of the Ca2+ chelator BAPTA. Traces represent the time courses of ICRAC activation measured at −40 mV from the instantaneous voltage ramps, used to monitor ICRAC development every 2 s, as shown in the inset. Currents from single cells were normalized to the cell capacitance, as indicator of the cell size, and plotted as average ± SE (from five to eight cells averaged for each condition); continuous trace, control; dashed trace, tCRT-transfected cells. The dotted line shows the zero current level. Inset, normalized current-voltage relationships, obtained by voltage ramps from −100 to +100 mV, lasting 50 ms and delivered at 0.5 Hz. The traces show the normalized current recorded before and after maximal activation in a typical experiment. The arrow shows the normalized current values measured at −40 mV and used to plot the time course of ICRAC activation.

