
FIG. 3.
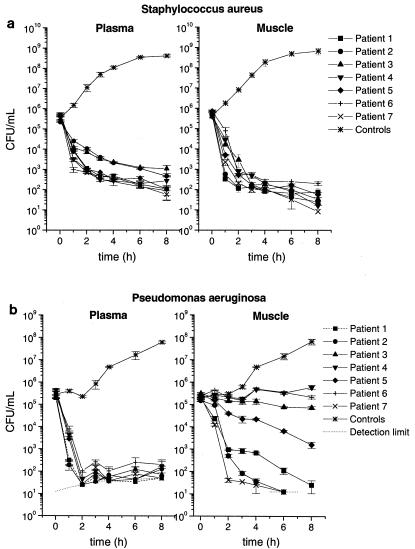
Killing-versus-time curves for clinical isolates of S. aureus (MIC = 0.5 μg/ml) (a) and P. aeruginosa (MIC = 2 μg/ml) (b) after exposure to levofloxacin at concentrations determined from individual free concentration versus-time profiles obtained in plasma and skeletal muscle tissue. Data for bacterial growth controls are also shown. All data are presented as means ± standard errors of the means (n = 3). The detection limit is represented by the dotted lines.