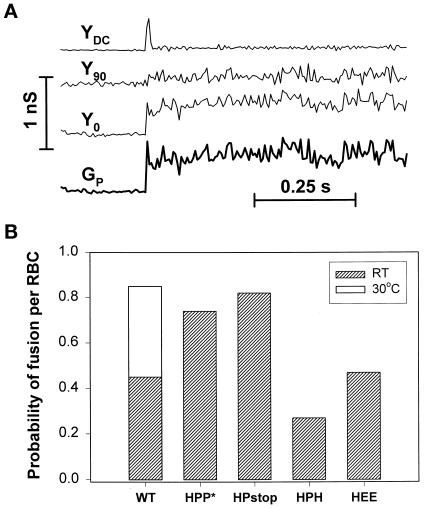
Figure 6.
Characteristic electrical signals upon opening of a fusion pore between an RBC and a CV-1 cell and probability that a bound RBC did fuse. (A) The DC conductance (YDC) and in-phase (Y0), and out-of-phase (Y90) conductances were measured by the patch-clamp technique in a whole-cell mode, allowing the fusion pore conductance (GP) to be calculated. The opening of a fusion pore was accompanied by a spike in DC conductance and changes in Y0 and Y90. (B) The number of current spikes in YDC yields the number of RBCs that have fused to the cell. By counting the number of RBCs bound to the CV-1 cell, the probability of fusion per bound RBC was obtained.

