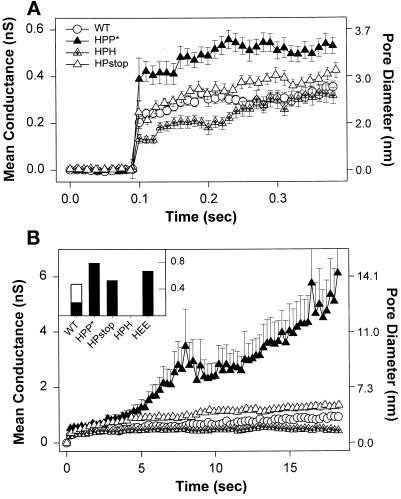
Figure 9.
Average conductance profiles of pores at early and later times after formation. Pores were aligned at their opening, and the mean and SE of the conductance over time were determined for the entire population of pores. Sample sizes: WT HA (open circles), n = 32; HPP* (filled triangles), n = 20; HPstop (open triangles), n = 28; and HPH (triangles with cross), n = 27. The approximate diameters of fusion pores in nanometers (Spruce et al., 1989) are shown on the right axis. (A) The initial conductance of pores induced by HPP* was statistically (p < 0.001) larger than formed by the other constructs. (B) Pores formed by HPP* readily enlarge. Once a pore had increased beyond the measurable range, the conductance for this experiment was artificially fixed at the largest detectable value for purposes of calculating the remainder of the profile. This would cause the calculated average conductance to increasingly underestimate the true value as time advances (see MATERIALS AND METHODS). For visual clarity, one of every 25 points of pore profiles is shown. Inset, The fraction of pores that had enlarged beyond 4 nS in 2 min (error bars are omitted for visual clarity). The enlargement for WT HA-expressing cells at 30°C (open bar, n = 14) was greater than at room temperature (filled bars).

