
FIG. 2.
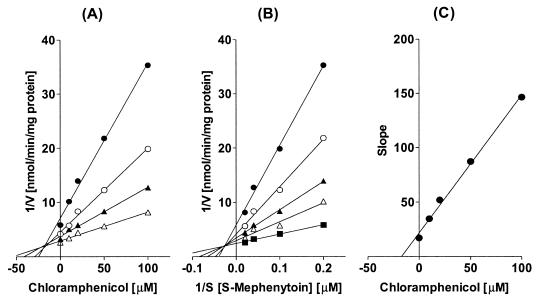
(A) Representative Dixon plot for the inhibition by chloramphenicol (0 to 100 μM) of CYP2C19-catalyzed S-mephenytoin 4′-hydroxylation in human liver microsomes with 25 (•), 50 (○), 75 (▴), or 100 (▵) μM S-mephenytoin. (B) Lineweaver-Burk plot of CYP2C19-catalyzed S-mephenytoin 4′-hydroxylation in the absence (▪) or presence of 10 (▵), 20 (▴), 50 (○), or 100 (•) μM chloramphenicol. (C) Secondary plot of slopes taken from Lineweaver-Burk plots versus chloramphenicol concentration. Each data point represents the average of duplicate measurements.