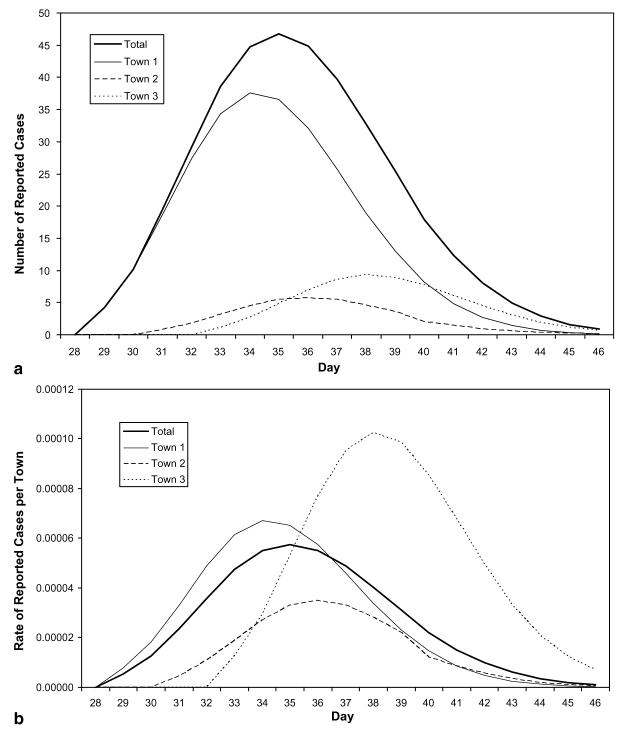
Fig. 2.
(a) Number of reported cases – geographic decomposition. The counts are shown here, illustrating each town's contribution to the total reported case count. (b) Rate of reported cases – geographic decomposition. The rates of incidence illustrate the relative prevalence of disease in each town.

