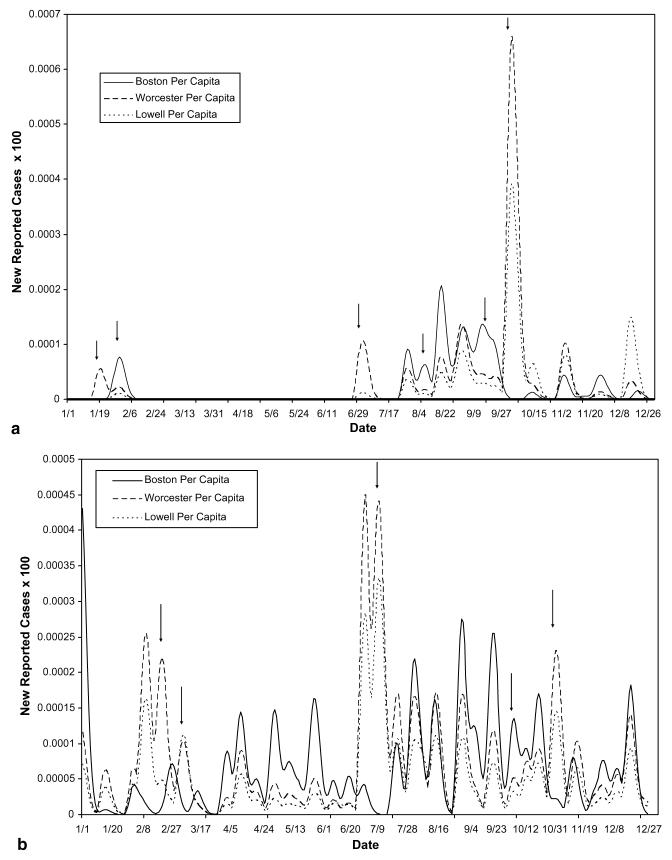
Fig. 6.
(a) Total rates of cryptosporidiosis in 1995 – geographic decomposition. (b) Total rates of giardiasis in 1995 – geographic decomposition. Arrows highlight areas of the decomposition which indicate that the best fit scenario produced by the combinatorial model suggests a differential impact of disease at different times, in the different cities. These differences would go unnoticed using average mass action transfer terms.

