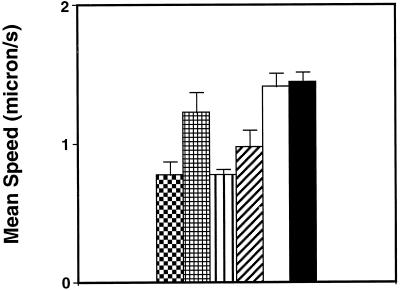
Figure 2.
Analysis of mean speed of wild-type, ExEh20, and LMM transfectant amoebae. The histogram shows the comparison of the means speed of the two subpopulations of LMM20: slower ( ) and LMM20 faster ( ). The same type of representation was chosen for LMM30: slower (▥) and LMM30 faster (▨). Finally, the mean speeds for ExEh20 (□) and wild type (▪) are represented.

