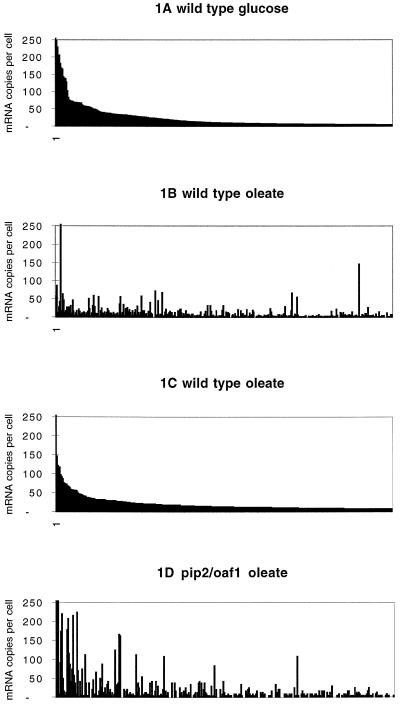
Figure 1.
Display of steady-state mRNA levels in yeast grown on different carbon sources. Each bar represents one mRNA species. (A) Display of mRNA levels in glucose-grown wild-type yeast. The 500 highest expressed genes are sorted by levels of mRNA copies per cell. (B) mRNA levels in oleate-grown wild-type cells. The genes are sorted in the same order as in A. (C) mRNA levels of the 500 highest expressed genes in oleate-grown wild-type cells. The genes are sorted by levels of mRNA copies per cell. (D) mRNA levels in oleate-grown pip2/oaf1 cells. The genes are sorted in the same order as in C.

