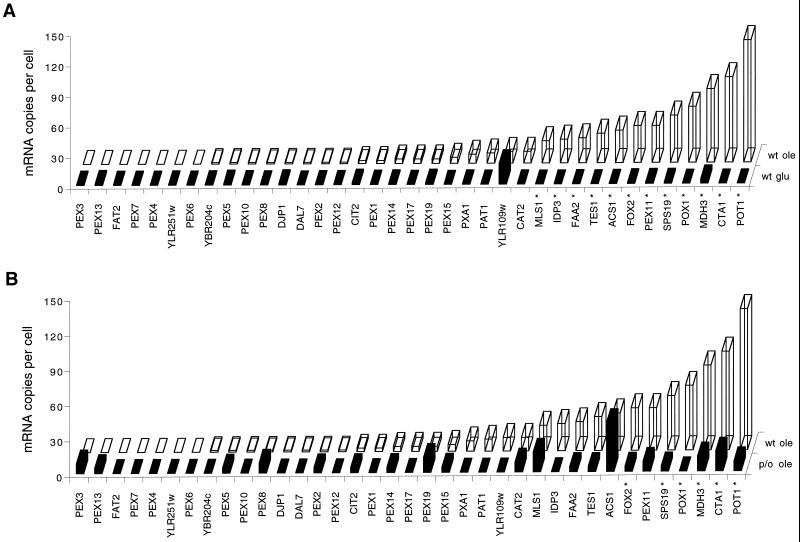
Figure 2.
mRNA levels of genes encoding peroxins and peroxisomal matrix enzymes. (A) Bars in the front row represent mRNA levels in glucose-grown wild-type cells (wt glu); bars in the back row represent mRNA levels in oleate-grown wild-type cells (wt ole). Note that all peroxins localize to the left, whereas all matrix enzymes localize to the right, stressing the differences in expression levels between the two classes of genes. (B). Bars in the back row represent mRNA levels in oleate-grown wild-type cells (wt ole); bars in the front row represent mRNA levels in oleate-grown pip2/oaf1 cells (p/o ole). *, Statistically significant difference in expression levels (p < 0.05).

