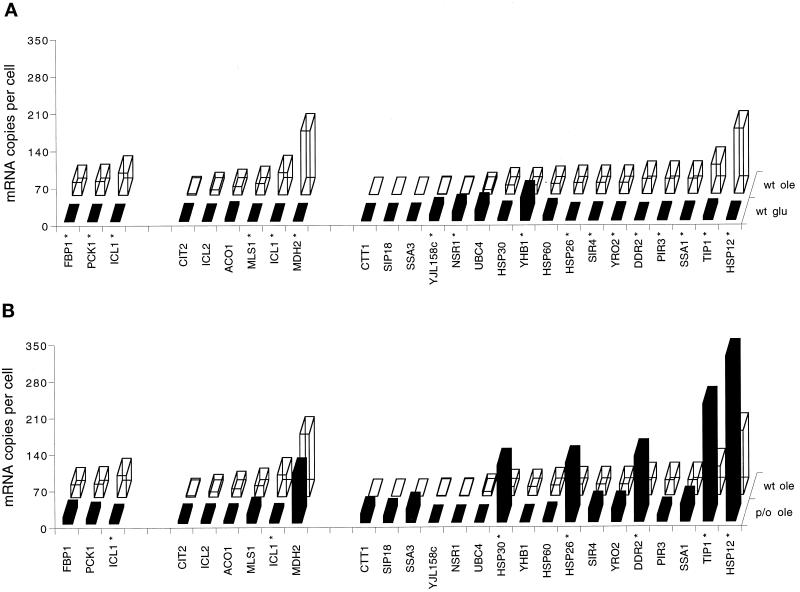
Figure 5.
mRNA levels of genes encoding proteins for gluconeogenesis, glyoxylate cycle, and heat shock and stress response. (A) Bars in the front row represent mRNA levels in glucose-grown wild-type cells (wt glu); bars in the back row represent mRNA levels in oleate-grown wild-type cells (wt ole). (B). Bars in the front row represent mRNA levels in oleate grown pip2/oaf1 cells (p/o ole); bars in the back row represent mRNA levels in oleate grown wild-type cells (wt ole). *, Statistically significant difference in expression levels (p < 0.05).

