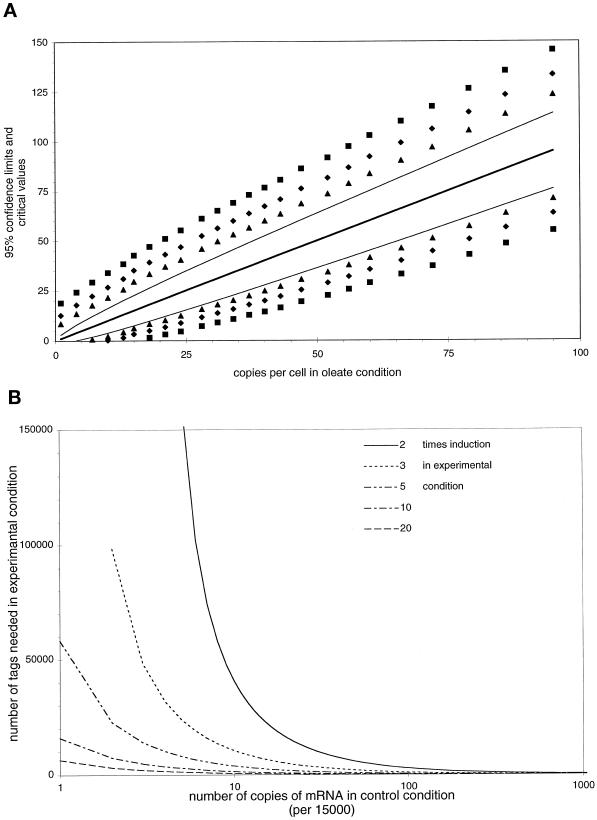
Figure 6.
Statistical analysis. (A) Ninety-five percent confidence intervals (thin lines) for the number of copies per cell found in the oleate condition (thick line) and critical values for the statistical comparison of these numbers with numbers found in a control condition. Control values that fall outside the critical values can be considered different from the corresponding control value at significance levels of 0.05 (▴), 0.01 (♦) and 0.001 (▪), respectively. Calculations are carried out for a sample size of 10,366 sequenced tags in the oleate condition and 60,633 in the control condition, assuming the total number of mRNA molecules in a yeast cell to be 15,000. (B). Number of tags required in the experimental group to detect a 2- to 20-fold induction in abundance of mRNA compared with the control group from which 60,633 tags already have been sequenced. Calculations were performed with the SAGEstat software, assuming the total number of mRNA molecules in a yeast cell to be 15,000, with α = 0.05 and β = 0.1.

