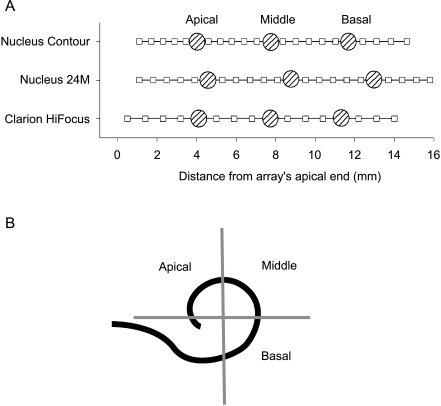
Fig. 3.
Relative probe electrode location for three array configurations. A Location of all electrodes with respect to the apical end of the electrode array (squares) is shown for the three electrode arrays implanted in the subject population. Stippled circles demonstrate the three probe electrode locations used to measure interaction. B Schema of an inserted electrode array as seen via a “cochlear view” x-ray. The probe locations were chosen to represent each of the three quadrants of the first turn of the cochlea shown in this schema. The spiral represents the view of the electrode array in a cochlear view x-ray (Cohen et al. 1996a). The quadrants containing the apical, middle, and basal probe electrode locations are delineated by the gray lines and labeled accordingly.

