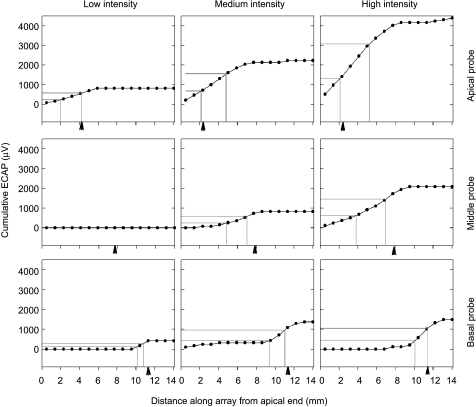
Fig. 5.
Analysis of one subject’s electrode interaction. Cumulative ECAP amplitude is first calculated as a function of distance (in millimeters) along the electrode array, as shown for the corresponding panels from the interaction functions in Figure 4. The points along the function whose cumulative ECAP value is 30% and 70% of the maximum value are shown as gray lines. The corresponding interaction is defined by the distance along the array between the two vertical gray lines. Arrowheads mark the position of the masker electrode for reference.

