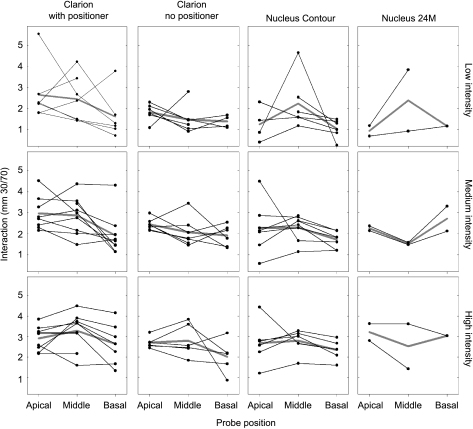
Fig. 6.
Trends of electrode interaction in individual subjects at different probe locations. Each panel represents a group of subjects with the same array configuration and stimulus intensity. Subjects with the same electrode configuration are arranged in columns, while stimulus intensity is arranged in rows. Lines connect values of electrode interaction for the three different probe locations—apical, middle, and basal. Missing points occur where interaction could not be measured. Mean values are shown by the gray line.

