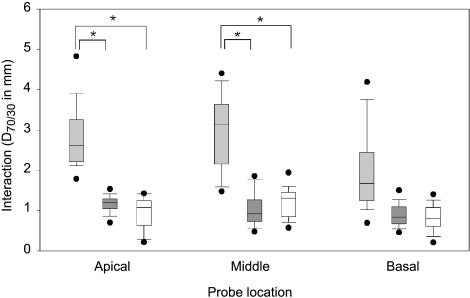
Fig. 8.
Influence of array configuration on electrode interaction. Box plot showing interaction for subjects with the Clarion Hi-Focus I array with positioner (light gray), Hi-Focus I array without positioner (dark gray), or Nucleus Contour array (white) at the three different probe locations. Asterisk depicts significant differences between groups (p < 0.05). Box plots represent the median value, the 25th and 75th percentile (box), the 10th and 90th percentile (error bars), and minimum and maximum values (dots).

