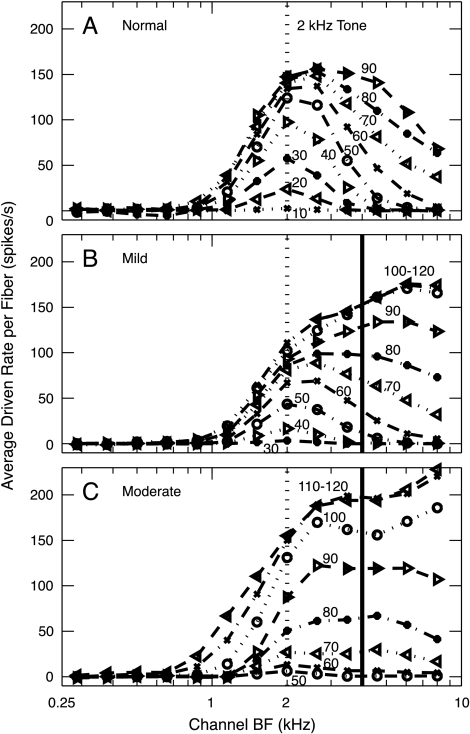
Fig. 4.
Average driven rate (rate minus SR) per fiber as a function of level in 0.4-octave BF channels. The stimulus was a 2-kHz tone (dotted vertical line), and the sound level (in dB SPL) is the parameter on the curves. Results are shown for the normal, mildly impaired, and moderately impaired populations. The solid vertical lines show the BF channels at which best thresholds return to near normal for higher BFs. Note that data were not typically collected from AN fibers in the normal population at levels above about 90 dB SPL.

