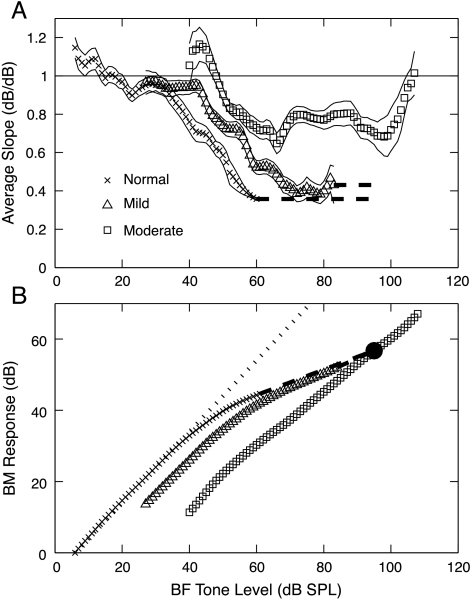
Fig. 5.
Estimated BM slopes and input–output functions derived from AN rate functions. (A) Slope estimates averaged across three populations of fibers, defined in the legend. Estimates were smoothed as described in Methods. Thin lines are plotted one standard error away from the slope estimates. (B) Estimated BM input–output functions computed by integrating the slopes in A. The dotted line shows 1 dB/dB response growth. The dashed lines show extrapolations of the slope estimates. The constants of integration were chosen to make the functions equal at 95 dB SPL (filled circle).

