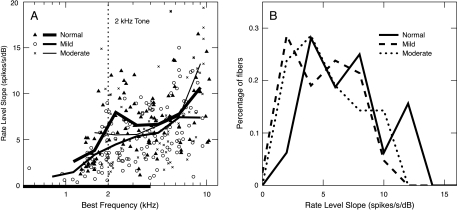
Fig. 6.
(A) Low-level slopes of rate functions in response to 2-kHz tones are plotted versus BF for the three populations, identified in the legend. Points are the results for individual fibers, and the solid lines are moving averages based on an octave-wide triangular window advanced in half-octave steps. All SR groups were included in the averages, and a minimum of three fibers was required within each window. The range of significant threshold shift in the impaired populations is shown by the heavy line on the abscissa. (B) Distributions of low-level slopes are shown for each population. Only AN fibers with BFs within the elevated threshold region and above the tone frequency (i.e., 2–4 kHz) were included. BFs below 2 kHz were excluded because of the normal frequency dependence in slope for fibers with BFs below the tone frequency (see text).

