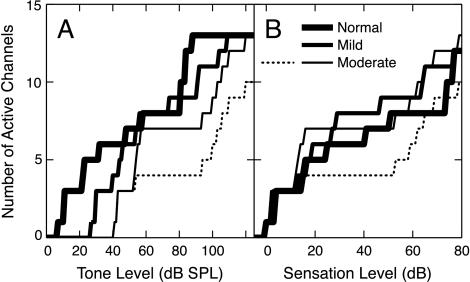
Fig. 7.
The spread of excitation versus sound level. The number of 0.4-octave channels having an average driven rate of at least 1.4 spikes/s/fiber is plotted as a function of (A) tone level and (B) sensation level (dB re threshold in the 2-kHz BF channel). The stimulus is the 2-kHz tone. Populations are identified in the legend. Solid lines: all channels shown in Fig. 4 are included. Dotted line: the three channels with BFs above 4 kHz are excluded from the moderate population.

