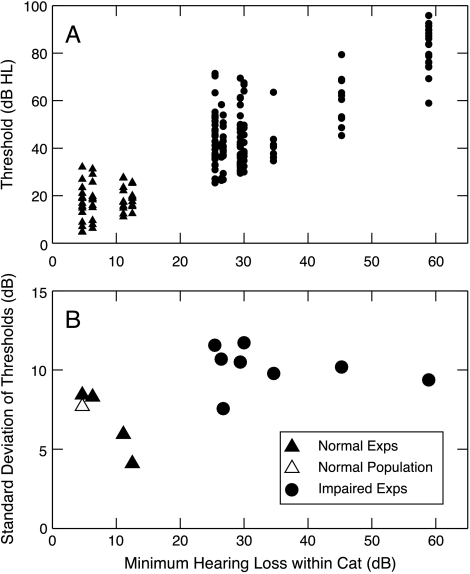
Fig. 9.
The effect of impairment on AN fiber threshold distributions. (A) Tuning curve thresholds for BFs from 1 to 3 kHz are plotted as a function of minimum threshold for normal and impaired ears. These are all the cases in which there were five or more fibers in this BF range. Thresholds are given in dB HL, i.e., relative to the best thresholds in normal cats from our supplier (NBTC, Miller et al. 1997). Data from both mild and moderate impairments are shown. (B) Standard deviations of the threshold distributions in A are plotted as a function of minimum threshold. Filled symbols: individual experiments. Open triangle: entire normal-hearing population.

