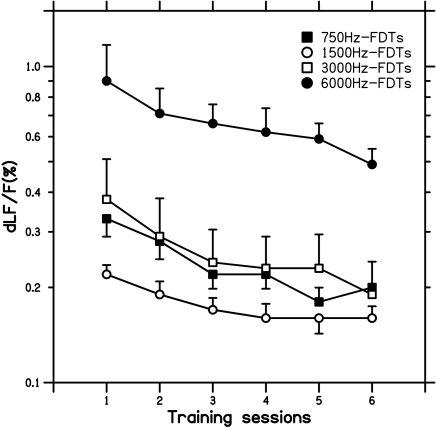
Fig. 2.
FDTs measured on consecutive training sessions in each frequency-training group. The symbols identifying the different training groups/frequencies are the same as in the previous figure. Each of the connected data points is the (geometric) mean of 15 thresholds measured on each session in each of eight listeners (a total of 120 threshold estimates per point). The (geometric) mean FDTs at the training frequency corresponding to each training group are also shown here as unconnected data points on the left and right for the pre- and posttraining sessions. The error bars show geometric standard errors.

