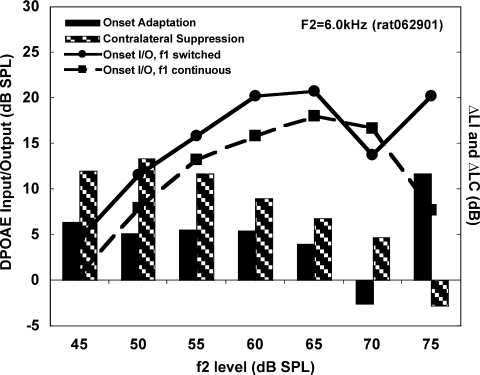
Fig. 10.
DPOAE I/O functions are plotted as a function of f2 level using the f1 switched condition (solid lines) and the f1 continuous condition (dashed lines) pre-MEM section. For each f2 level, the ΔLI (black bars) and ΔLC (patterned bars) are plotted. It can be seen that the direction of ΔLI and ΔLC are tied with the nonmonotonicities of the I/O functions.

