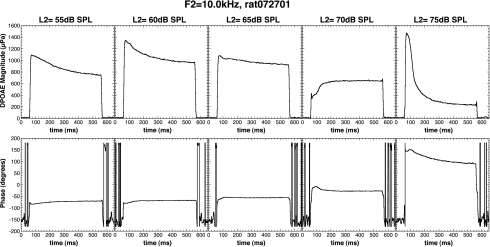
Fig. 3.
DPOAE magnitude (top row) and phase (bottom row) using the switched f1 condition and an f2 frequency of 10 kHz in rat 072701. Middle-ear muscles were intact. The f2 stimulus levels used to evoke the magnitude and phase temporal responses are indicated at the top of each magnitude panel. ΔLI changes with primary level and reverses direction for L2 = 70 dB SPL. ΔPI are small and exhibit a pattern that is tied with the stimulus level.

