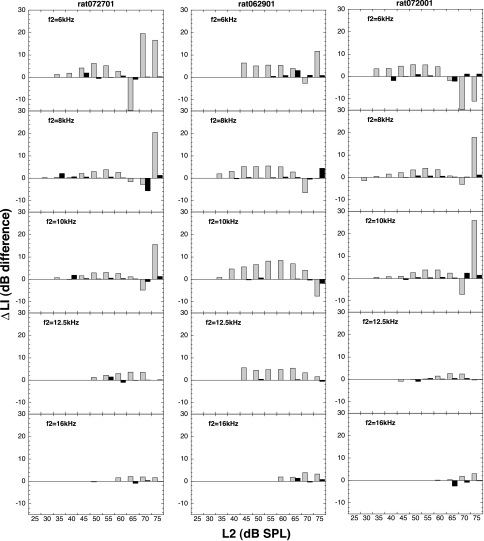
Fig. 8.
ΔLI as a function L2 for three rats. Each column illustrates data for a different rat. Each row depicts data for different f2 frequencies, starting from the lowest frequency tested at the top of the column to the highest frequency tested at the bottom of the column. Textured bars represent ΔLI when MEMs were intact, and black bars depict ΔLI after MEM sectioning.

