FIG. 3.
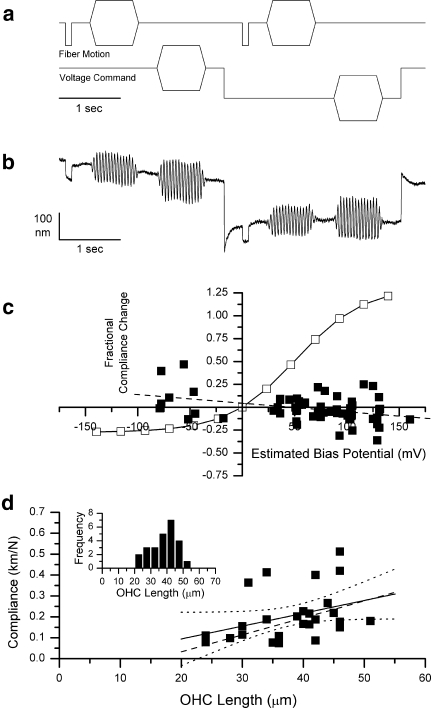
Determination of voltage dependence of compliance by the compressive pulse method. a Voltage command and fiber motion command waveforms as a function of time. b Typical fiber motion waveform in response to the above fiber and voltage commands. This cell was 39 μm long, and the biasing step voltage command was 300 mV. The calculated compliance was 0.183 km/N before and 0.178 km/N during the bias voltage command. c Fractional compliance change as a function of estimated membrane potential change for 63 measurements from 26 cells (all cells studied from six animals). The solid line represents the expected fractional compliance change if the cell behaved like the reference cell. The dashed line fitted to the data has a slope of 0.00094/mV and an intercept of 0.044. d Resting compliance as a function of cell length for the 26 cells used in this part of the study. The fitted line (R = 0.37) has a slope of 0.00614 km M−1 μm−1. The dashed line represents the compliance versus length function for the 89 cells in Hallworth (1997b). Inset Histogram of lengths of cells used in this part of the study.

