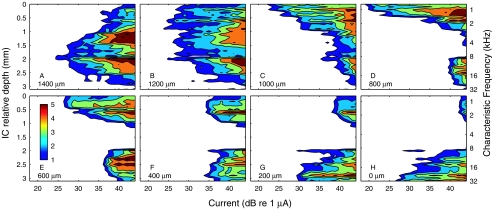
FIG. 5.
Spatial tuning curves elicited by intraneural stimulation. Each panel corresponds to one stimulus site, labeled according to depth relative to the most proximal (i.e., superficial) stimulation site. Illustrated examples are from 8 of the 16 available sites on the stimulating array. These spatial tuning curves appear somewhat patchier than those for acoustic stimulation in Figure 1, largely because these data for intraneural stimulation were collected at 32 stimulus levels in 1-dB steps, whereas the data for acoustic stimulation were collected at only 13 levels in 5-dB steps, necessitating somewhat greater interpolation in the contour plots. Cat0509.

