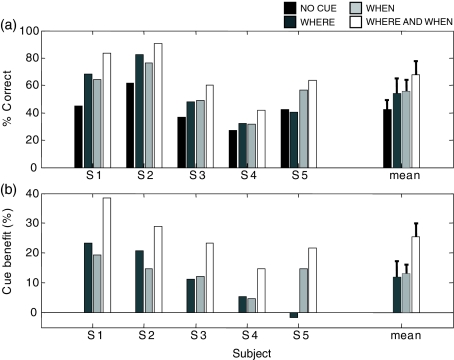
FIG. 2.
(a) Percent correct scores in experiment 1. Shown are individual data from the five subjects as well as the across-subject mean (error bars represent the standard error of the mean). The four bars within a group represent the four attention conditions, as labeled. (b) Cue benefits in experiment 1, calculated by subtracting scores in the no cue condition from scores in the other conditions. Shown are the individual benefits as well as the across-subject mean (error bars represent the standard error of the mean).

