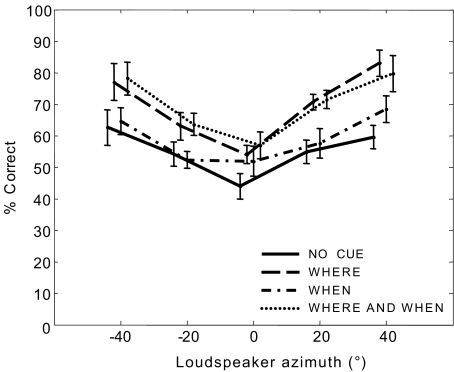
FIG. 6.
Mean percent scores in experiment 2A as a function of target loudspeaker (pooled over all subjects and all target time segments). The four lines represent the four attention conditions, as labeled. Error bars indicate standard errors of the across-subject mean, and are staggered horizontally for clarity.

