
Figure 2.
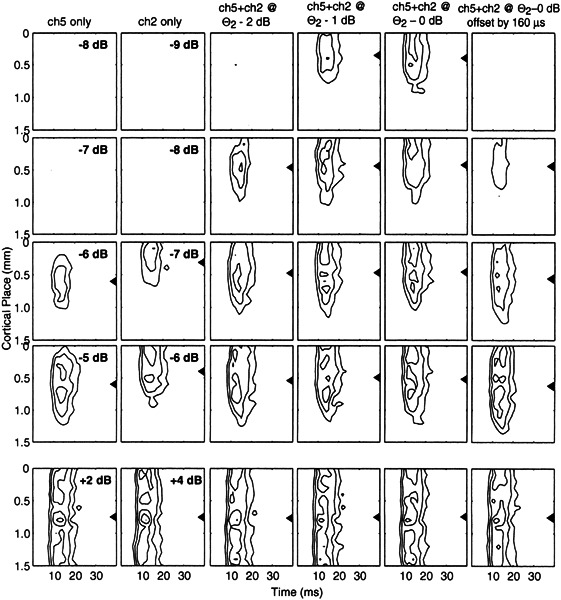
Cortical images of one- and two-channel stimuli. Each panel represents the cortical image of one stimulus averaged across 10 trials. The left two columns represent responses to single-channel stimulation of channels 5 (first column) and 2 (second column). Current levels are expressed in dB re: 1 mA. Columns 3, 4, and 5 represent two-channel stimulation in the simultaneous condition with the current level on channel 2 fixed at 2, 1, and 0 dB, respectively, below the threshold for channel 2 alone (i.e., Θ2−2, Θ2−1, and Θ2). The rightmost column represents a condition in which the stimulus level on channel 2 was fixed at Θ2 with a temporal offset of 160 µs. For each cortical image, the abscissa represents poststimulus time and the ordinate represents cortical place relative to the most caudal recording site. Contours represent mean spike counts expressed as percent of the maximum count on each cortical channel; contours are drawn at 20, 40, 60, and 80% of the maximum count. Triangles to the right of each panel represent the centroid locations. Data are from animal GP02.