
Figure 4.
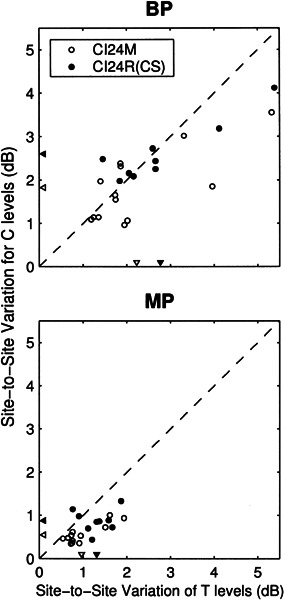
Comparison of site-to-site variation (as defined in Fig. 3) for C levels with that for T levels for BP and MP stimulation. Each circle represents an individual subject. Means of the distributions are indicated by the triangles on the axes. Open symbols are for the CI24M implant and filled symbols are for the CI24R(CS) implant.